Overview
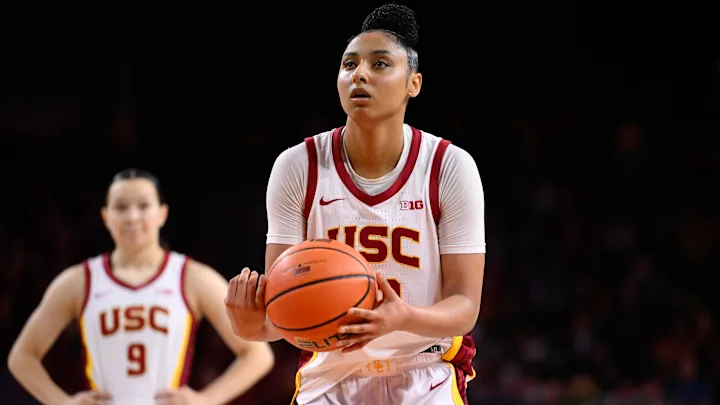
Many star players have come out of USC in recent seasons, with names like Juju Watkins and Jazzy Davidson escaping the sphere of USC alumn and entering mainstream. The USC womens basketcall team is a historically strong program, having won two NCAA championships. However, the last time we won was in 1984, so do we deserve that reputation? By looking through the last two decades of seaon stats, I hope to better understand the trajectory of our team's accomplishments and current rankings among other top schools.
Season stats, 2006-2026
| Rk | Season | Conf | W | L | W-L% | W | W-L% | SRS | SOS | PS/G | PA/G | Coach(es) | |
|---|---|---|---|---|---|---|---|---|---|---|---|---|---|
| 1 | 2025-26 | Big Ten | 12 | 9 | 0.571 | 4 | 6 | 0.4 | 30.46 | 21.7 | 69 | 60.3 | Lindsay Gottlieb (12-9) |
| 2 | 2024-25 | Big Ten | 31 | 4 | 0.886 | 16 | 1 | 0.941 | 39.46 | 18.18 | 80.7 | 59.4 | Lindsay Gottlieb (31-4) |
| 3 | 2023-24 | Pac-12 | 29 | 6 | 0.829 | 13 | 5 | 0.722 | 30.21 | 17.78 | 74.9 | 62.5 | Lindsay Gottlieb (29-6) |
| 4 | 2022-23 | Pac-12 | 21 | 10 | 0.677 | 11 | 7 | 0.611 | 22.21 | 13.05 | 64.2 | 55.1 | Lindsay Gottlieb (21-10) |
| 5 | 2021-22 | Pac-12 | 12 | 16 | 0.429 | 5 | 12 | 0.294 | 12.79 | 13.15 | 64.3 | 64.7 | Lindsay Gottlieb (12-16) |
| 6 | 2020-21 | Pac-12 | 11 | 12 | 0.478 | 8 | 10 | 0.444 | 14.47 | 19.73 | 63.6 | 68.9 | Mark Trakh (11-12) |
| 7 | 2019-20 | Pac-12 | 17 | 14 | 0.548 | 8 | 10 | 0.444 | 13.8 | 13.16 | 64.8 | 64.2 | Mark Trakh (17-14) |
| 8 | 2018-19 | Pac-12 | 17 | 13 | 0.567 | 7 | 11 | 0.389 | 17.33 | 14.4 | 69.9 | 67 | Mark Trakh (17-13) |
| 9 | 2017-18 | Pac-12 | 20 | 11 | 0.645 | 9 | 9 | 0.5 | 19.57 | 12.48 | 67.7 | 60.6 | Mark Trakh (20-11) |
| 10 | 2016-17 | Pac-12 | 14 | 16 | 0.467 | 5 | 13 | 0.278 | 16.54 | 14.14 | 67.5 | 65.1 | Cynthia Cooper (14-16) |
| 11 | 2015-16 | Pac-12 | 19 | 13 | 0.594 | 6 | 12 | 0.333 | 18.55 | 12.1 | 66.6 | 58.8 | Cynthia Cooper (19-13) |
| 12 | 2014-15 | Pac-12 | 15 | 15 | 0.5 | 7 | 11 | 0.389 | 13.14 | 10.2 | 68 | 65 | Cynthia Cooper (15-15) |
| 13 | 2013-14 | Pac-12 | 22 | 13 | 0.629 | 11 | 7 | 0.611 | 15.03 | 12.46 | 67.1 | 64.6 | Cynthia Cooper (22-13) |
| 14 | 2012-13 | Pac-12 | 11 | 20 | 0.355 | 7 | 11 | 0.389 | 7.95 | 12.6 | 61.5 | 66.1 | Michael Cooper (11-20) |
| 15 | 2011-12 | Pac-12 | 18 | 12 | 0.6 | 12 | 6 | 0.667 | 15.72 | 12.45 | 64 | 60.7 | Michael Cooper (18-12) |
| 16 | 2010-11 | Pac-10 | 24 | 13 | 0.649 | 10 | 8 | 0.556 | 15.35 | 12.02 | 69.2 | 65.9 | Michael Cooper (24-13) |
| 17 | 2009-10 | Pac-10 | 19 | 12 | 0.613 | 12 | 6 | 0.667 | 15.58 | 14.97 | 64.8 | 64.2 | Michael Cooper (19-12) |
| 18 | 2008-09 | Pac-10 | 17 | 15 | 0.531 | 9 | 9 | 0.5 | 72.9 | 69.1 | Mark Trakh (17-15) | ||
| 19 | 2007-08 | Pac-10 | 17 | 13 | 0.567 | 10 | 8 | 0.556 | 62.6 | 60.6 | Mark Trakh (17-13) | ||
| 20 | 2006-07 | Pac-10 | 17 | 13 | 0.567 | 10 | 8 | 0.556 | 66.2 | 62.4 | Mark Trakh (17-13) |
- "W-L%" - (Conference) Win-Loss Percentage
- Out of all games played throughout their season, 1 (which can be split by conference and outside play), what percentage ended in a win for USC.
- "SRS" - Simple Rating System
- SRS is a team-evaluation metric that combines a team's average point differential (margin of victory) with its strength of schedule (SOS) to rank teams based on how many points better or worse they are than an average team (0.0) EX: A team with an SRS of 10 pts is 10pts better than the average team on a neutral court.
- "SOS" - Strength of Schedule
- The foundation of SOS is averaging the winning percentages of all opponents a team has faced, as well as counting factors such as home, away, and neutral courts to assess strength of teams played.
- "PS/G" - Points Scored Per Game
- The AVG points USC scored across all games.
- "PA/G" - Points Allowed Per Game
- The AVG points scored against USC across all games.
When analyzing the data table against each year's performances, some elements that signify a strong team are obvious to spot. These are the Wins, Losses, and W-L%. In each, the better the winning ratio, it is intuitive that a team would generally make it further in the end of year playoffs. But, by taking a closer look at the 2023-24 and 2024-25 seasons, USC womens most successful from the last two decades, the stat that seems most influential is made obvious.
Seasons Reaching the NCAA Elite-8
| Rk | Season | Conf | W | L | W-L% | W | W-L% | SRS | SOS | PS/G | PA/G | Coach(es) | |
|---|---|---|---|---|---|---|---|---|---|---|---|---|---|
| 2 | 2024-25 | Big Ten | 31 | 4 | 0.886 | 16 | 1 | 0.941 | 39.46 | 18.18 | 80.7 | 59.4 | Lindsay Gottlieb (31-4) |
| 3 | 2023-24 | Pac-12 | 29 | 6 | 0.829 | 13 | 5 | 0.722 | 30.21 | 17.78 | 74.9 | 62.5 | Lindsay Gottlieb (29-6) |
Though other stats fluctuated between the years with noticably little guarranteed effect on a given season's outcome, such as the Strength of Schedule or Points Allowed Per Game, the highlighted stat in these years stood out dramatically from the rest. No matter how tough their schedule was, how much their let the other team score against, them, USC's ability to rally and score back was the defining characteristic of a winning season. There was only one season with a Point Scored Per Game number above 80, and that was when Juju Watkins lead the team to the NCAA Elite-8.
Unfortunately, an ACL injury has taken Juju out for this year's system. As the season start seems to show, this blow to the offensive output is almost guarranteed to kill their chance of returning for a third Elite-8 championship run. While I still have hope for my team, and will always be at the games, using the data of the past to inform this season is showing a bleak future.
Influential Players 2006-2026